One of the most important methods for tracking the evolution of infrastructure and its effects on the environment is change detection. In this work, we use Geographic Information Systems (GIS) and Remote Sensing (RS) to examine how railway station borders have changed between 2018 and 2023. Effective change detection is made possible by the combination of coding-based automation and Google Earth Engine (GEE).
In order to evaluate vegetation loss and urbanization inside railway station borders, the study focuses on computing the Normalized Difference Vegetation Index (NDVI) and Normalized Difference Built-up Index (NDBI). After visualization, the results are exported for additional examination.
The Cantonment Railway Station region in Bangalore is a rapidly urbanizing transit hub, making it ideal for analyzing vegetation loss and built-up expansion from 2018–2023
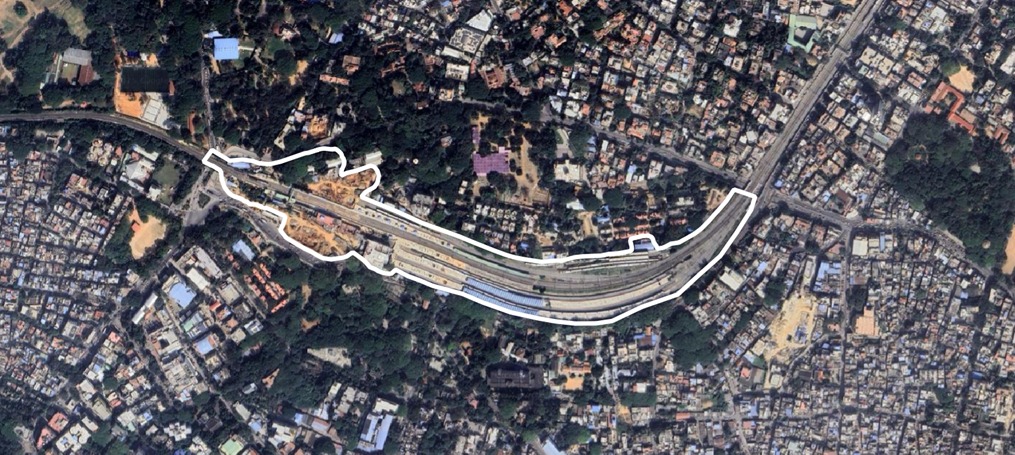
In 2018, the NDVI analysis showed a mean NDVI of 0.277, with a maximum of 0.801 (dense greenery) and a minimum of -0.025 (barren land or built-up areas). The classification indicated a balance between dense forest and built-up areas, with moderate urban development.
The NDBI for 2018 was 0.011, reflecting moderate urbanization. Built-up areas were mainly near railway tracks and station buildings, while significant vegetation was present around the station boundary.
The Land use land cover distribution showed no significant water bodies. Class 2 (Railway Track) covered 0.06 km², dominating the area with non-vegetated surfaces. Class 3 (Built-up) occupied 0.03 km², representing urban settlements with sparse vegetation. Class 4 (Dense Forest) accounted for 0.02 km², while Class 5 (Very Dense Forest) covered 0.01 km², indicating small patches of dense greenery.
By 2023, the mean NDVI dropped to 0.218, confirming vegetation loss. While the maximum NDVI remained at 0.801, the minimum increased to 0.009, indicating barren land conversion into built-up areas. The steady NDVI decline suggests rapid urbanization replacing natural vegetation.
The NDBI increased to 0.016, reflecting a rise in built-up areas due to railway expansions and commercial developments. The NDBI increase aligns with NDVI reduction, confirming the shift from green spaces to urban structures.
The Class 2 (Railway Track) area expanded to 0.08 km² from 0.06 km², indicating infrastructure growth. Class 3 (Built-up) declined to 0.02 km², suggesting conversion into railway infrastructure. Class 4 (Dense Forest) decreased to 0.01 km², showing medium-density vegetation loss. Class 5 (Very Dense Forest) remained at 0.01 km², preserving small patches of greenery. These changes confirm urbanization-driven vegetation loss within the railway station boundary.
The NDVI analysis showed a mean NDVI of 0.277, with a maximum of 0.801 (dense greenery) and a minimum of -0.025 (barren land or built-up areas). The classification indicated a balance between dense forest and built-up areas, with moderate urban development.
The NDBI for 2018 was 0.011, reflecting moderate urbanization. Built-up areas were mainly near railway tracks and station buildings, while significant vegetation was present around the station boundary.
The Land use land cover distribution showed no significant water bodies. Class 2 (Railway Track) covered 0.06 km², dominating the area with non-vegetated surfaces. Class 3 (Built-up) occupied 0.03 km², representing urban settlements with sparse vegetation. Class 4 (Dense Forest) accounted for 0.02 km², while Class 5 (Very Dense Forest) covered 0.01 km², indicating small patches of dense greenery.
The Bangalore Cantonment Railway Station region's NDVI change detection from 2018 to 2023 shows dynamic changes in vegetation patterns within a fast urbanizing terrain. Pockets surrounding the station are highlighted on the map with greening improvements (shown in green tones), which may be the result of tree planting campaigns, railroad corridor landscaping, or the restoration of adjacent institutional and defense grounds.
On the other hand, the presence of red and orange patches indicates regions where vegetation has been destroyed or degraded; these areas are frequently associated with surrounding urban developments, station expansion, or infrastructure upgrades. In and near transit centers like Bangalore Cantonment, this contrast highlights the conflicting demands of development and conservation, underscoring the necessity of integrated planning that maintains green cover while allowing for urban growth.
By 2018, the mean NDBI dropped to 0.218, confirming vegetation loss. While the maximum NDVI remained at 0.801, the minimum increased to 0.009, indicating barren land conversion into built-up areas. The steady NDVI decline suggests rapid urbanization replacing natural vegetation.
The NDBI increased to 0.016, reflecting a rise in built-up areas due to railway expansions and commercial developments. The NDBI increase aligns with NDVI reduction, confirming the shift from green spaces to urban structures.
The Class 2 (Railway Track) area expanded to 0.08 km² from 0.06 km², indicating infrastructure growth. Class 3 (Built-up) declined to 0.02 km², suggesting conversion into railway infrastructure. Class 4 (Dense Forest) decreased to 0.01 km², showing medium-density vegetation loss. Class 5 (Very Dense Forest) remained at 0.01 km², preserving small patches of greenery. These changes confirm urbanization-driven vegetation loss within the railway station boundary.
By 2023, the mean NDBI dropped to 0.218, confirming vegetation loss. While the maximum NDVI remained at 0.801, the minimum increased to 0.009, indicating barren land conversion into built-up areas. The steady NDVI decline suggests rapid urbanization replacing natural vegetation.
The NDBI increased to 0.016, reflecting a rise in built-up areas due to railway expansions and commercial developments. The NDBI increase aligns with NDVI reduction, confirming the shift from green spaces to urban structures.
The Class 2 (Railway Track) area expanded to 0.08 km² from 0.06 km², indicating infrastructure growth. Class 3 (Built-up) declined to 0.02 km², suggesting conversion into railway infrastructure. Class 4 (Dense Forest) decreased to 0.01 km², showing medium-density vegetation loss. Class 5 (Very Dense Forest) remained at 0.01 km², preserving small patches of greenery. These changes confirm urbanization-driven vegetation loss within the railway station boundary.
The mean NDVI dropped to 0.218, confirming vegetation loss. While the maximum NDVI remained at 0.801, the minimum increased to 0.009, indicating barren land conversion into built-up areas. The steady NDVI decline suggests rapid urbanization replacing natural vegetation.
The NDBI increased to 0.016, reflecting a rise in built-up areas due to railway expansions and commercial developments. The NDBI increase aligns with NDVI reduction, confirming the shift from green spaces to urban structures.
The Class 2 (Railway Track) area expanded to 0.08 km² from 0.06 km², indicating infrastructure growth. Class 3 (Built-up) declined to 0.02 km², suggesting conversion into railway infrastructure. Class 4 (Dense Forest) decreased to 0.01 km², showing medium-density vegetation loss. Class 5 (Very Dense Forest) remained at 0.01 km², preserving small patches of greenery. These changes confirm urbanization-driven vegetation loss within the railway station boundary.
Built-up areas have moderately increased in the Bangalore Cantonment Railway Station zone between 2018 and 2023, according to the NDBI change detection analysis, especially along main access routes and close to the station infrastructure. The map's red-toned zones show where urban surfaces have grown, most likely as a result of new building, station renovations, or an increase in business activity near the transit corridor.
Some green-toned areas, on the other hand, show places where built-up elements have decreased, perhaps as a result of land-use reclassification, demolition, or conversion to green or open spaces. Overall, the pattern points to urban intensification, with non-built-up areas occasionally recovering. This emphasizes how crucial it is to manage land sustainably, particularly in the vicinity of important transit hubs like Bangalore Cantonment, in order to maintain a balance between environmental health and infrastructure growth.


The NDVI class area distribution graph shows the decline of vegetation and increase in built-up areas over time.
This study effectively detected urbanization trends and changes in railway station boundaries using Sentinel-2 remote sensing and Google Earth Engine (GEE). The decline in NDVI by 34.87% highlights significant vegetation loss, while the 1.25% increase in NDBI indicates the expansion of built-up areas, emphasizing urbanization and infrastructure growth as primary drivers. The findings demonstrate the effectiveness of GIS and remote sensing in urban planning, providing valuable insights into land cover changes. Future steps include validating results with real-world satellite images, conducting correlation analysis between NDVI, NDBI, and urbanization trends, and integrating AI-based models for predictive analysis. This approach can be adapted for sustainable infrastructure projects, underscoring the importance of proactive urban planning and continuous monitoring to balance development with environmental preservation.
This project aims to expand the existing Sentinel-based NDVI and NDBI analysis (2018–2023) by incorporating high-resolution satellite data to provide more precise insights into:
To improve accuracy and add more detailed analysis, we propose using the following high-resolution satellite data