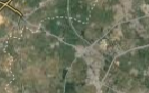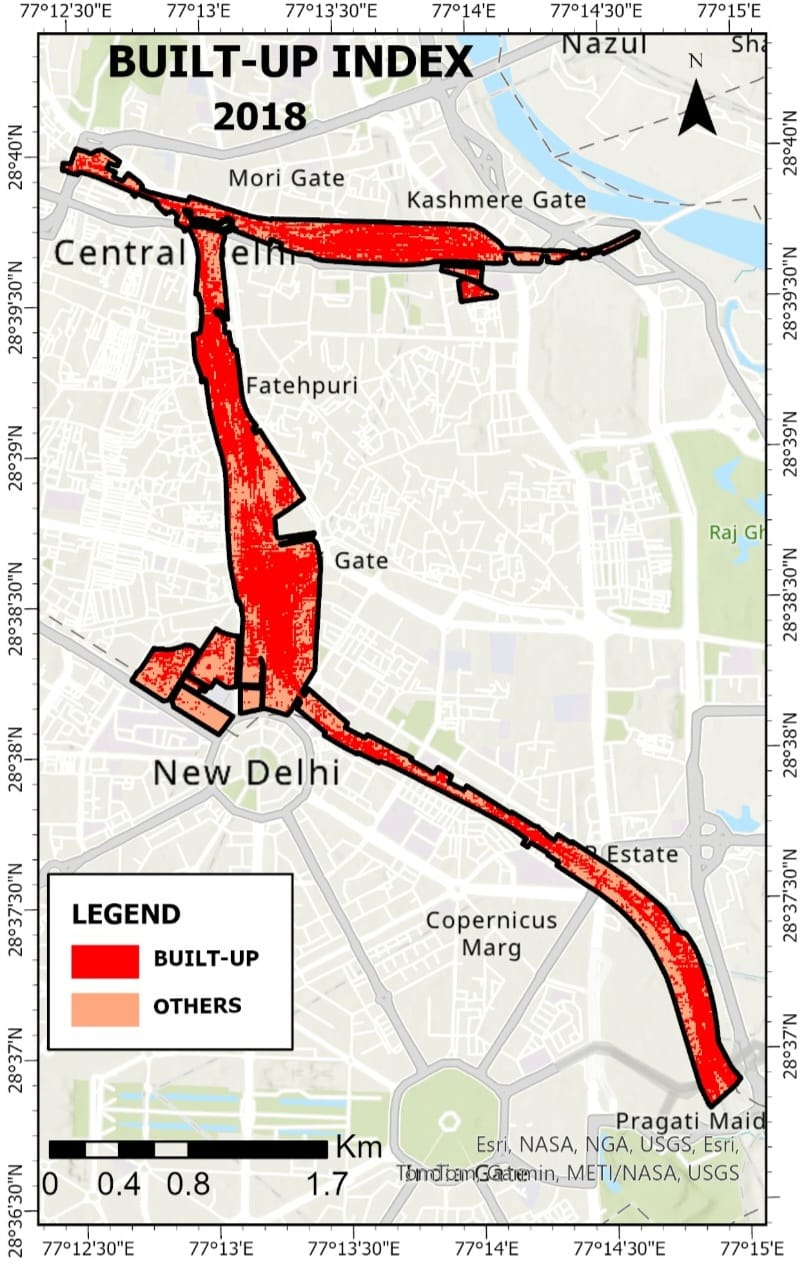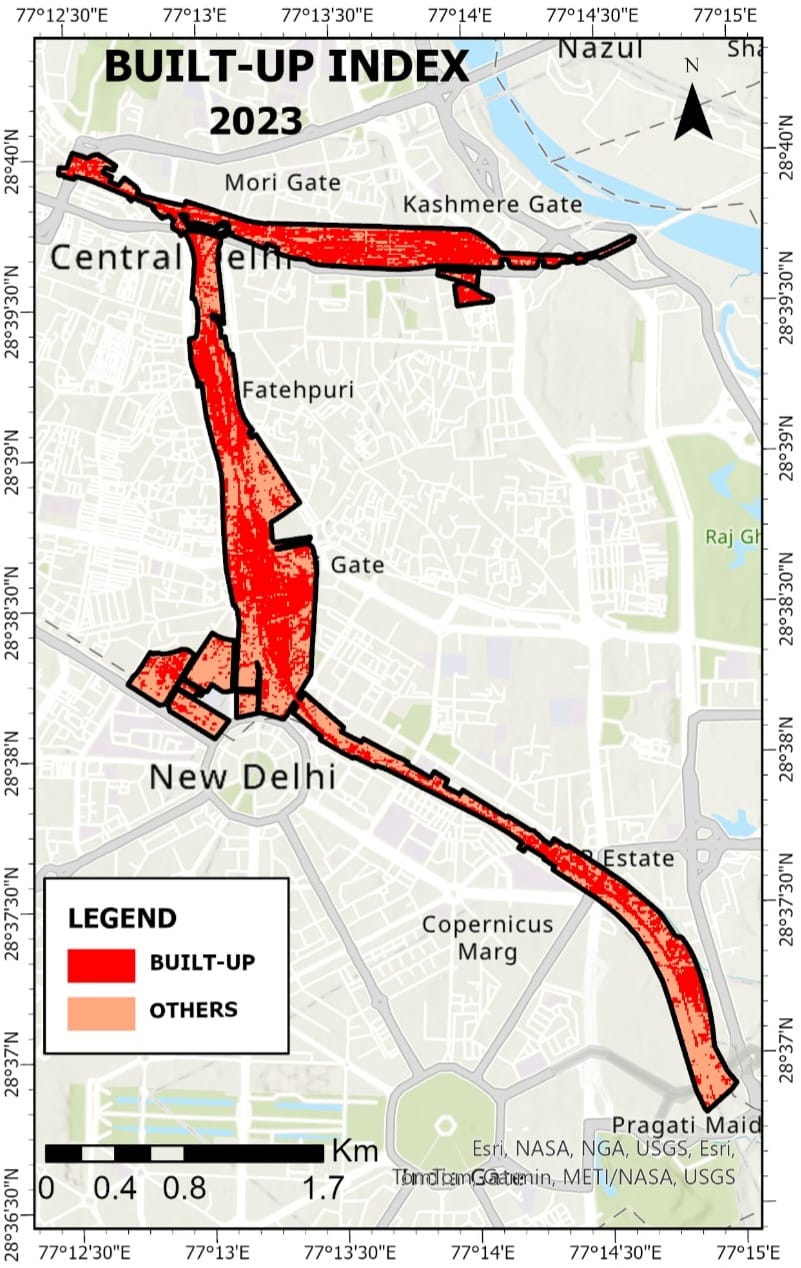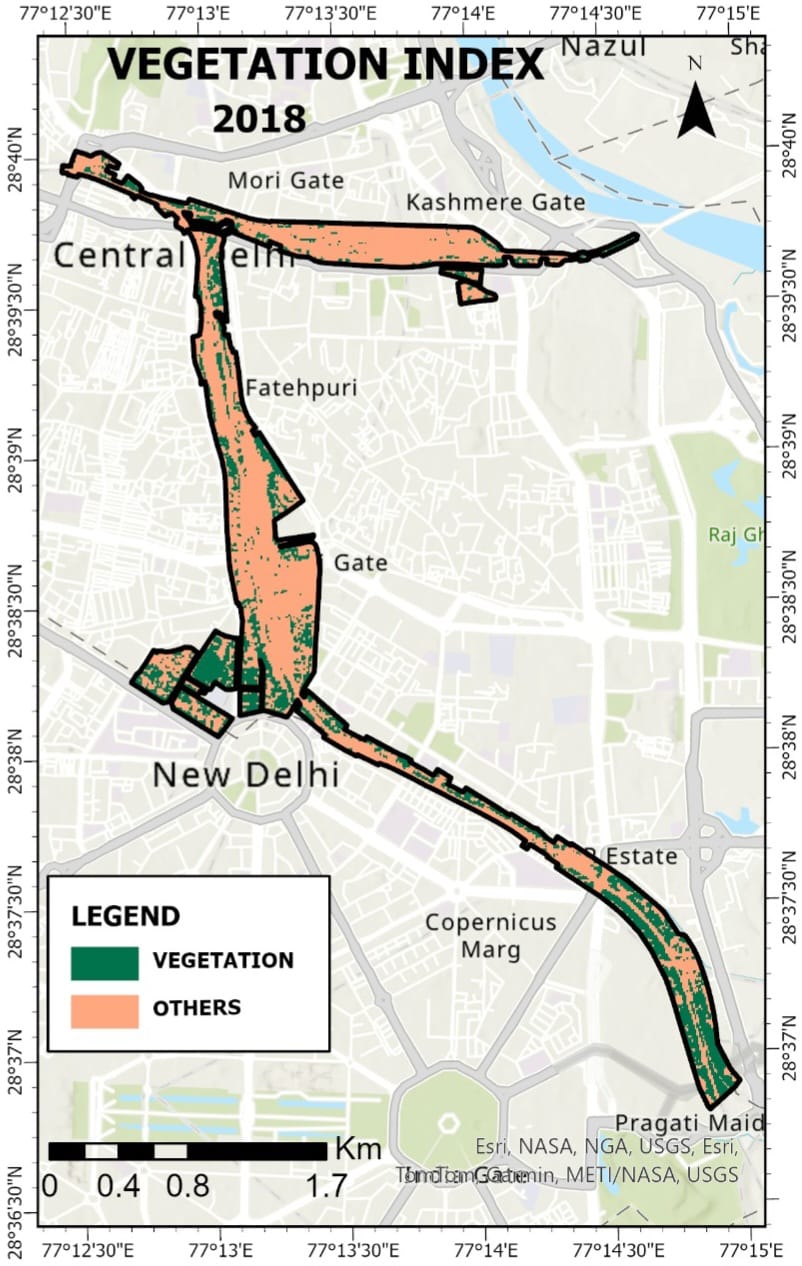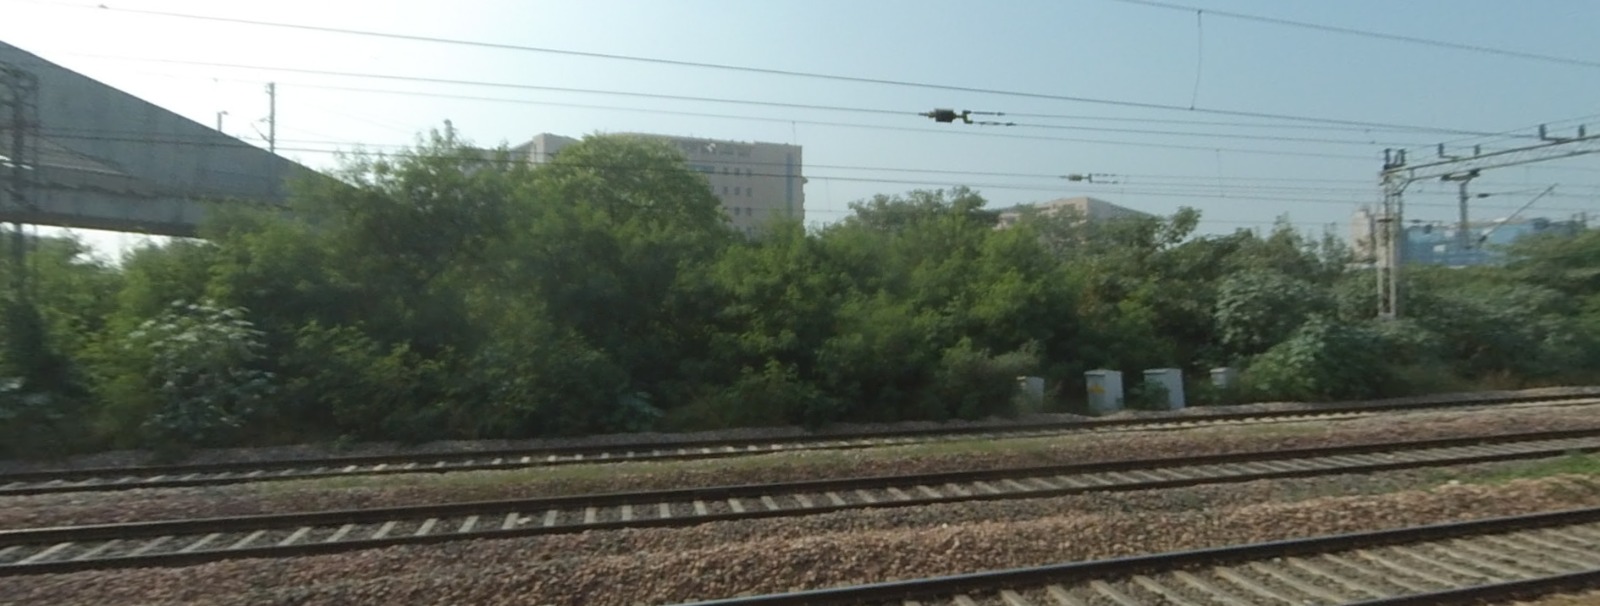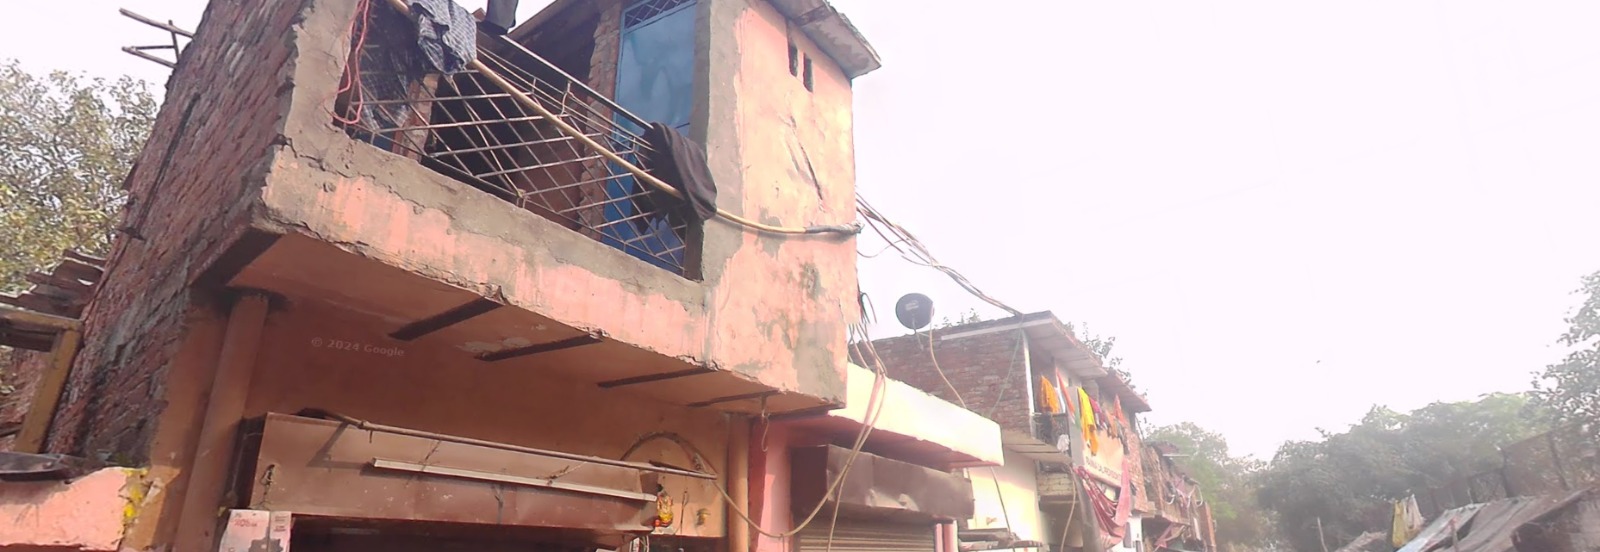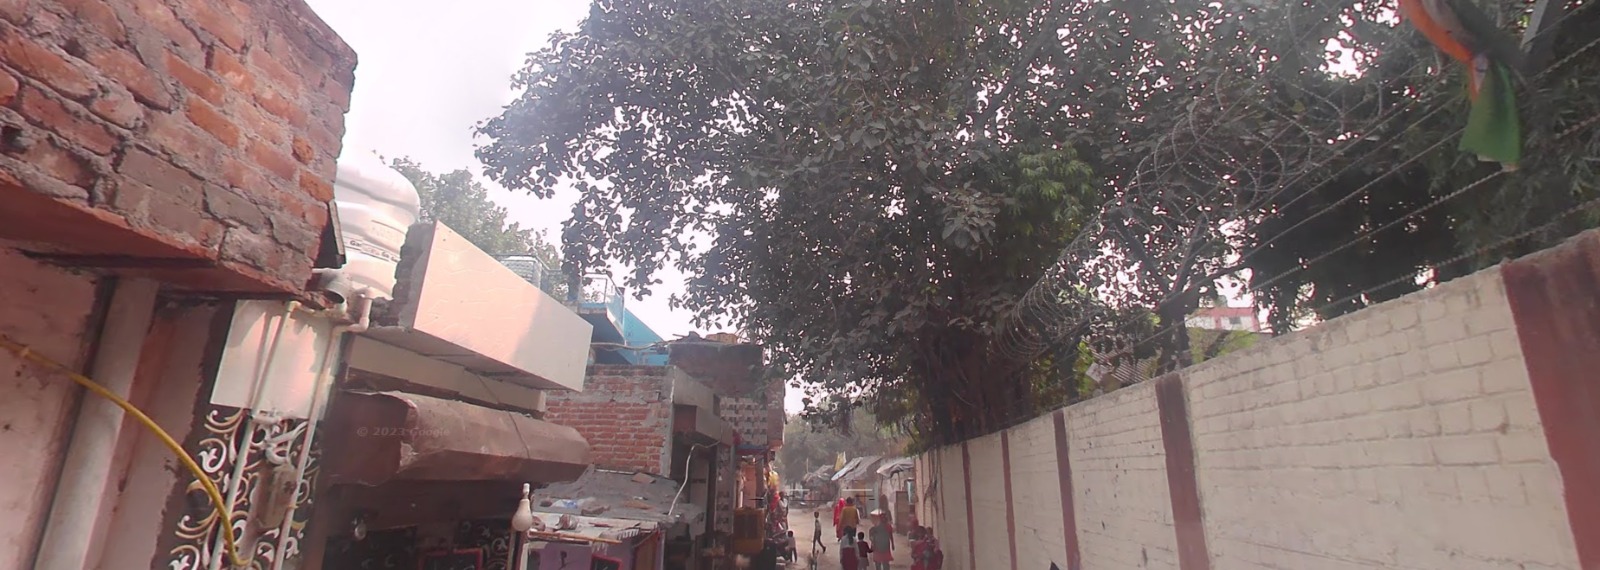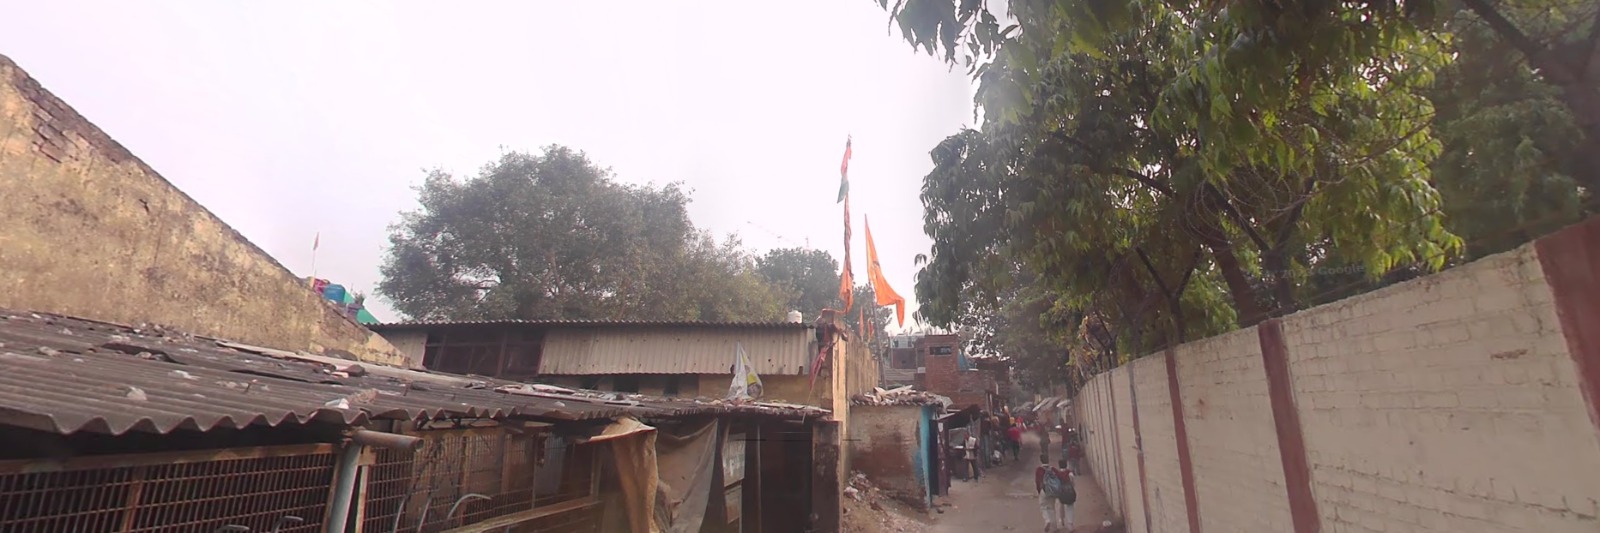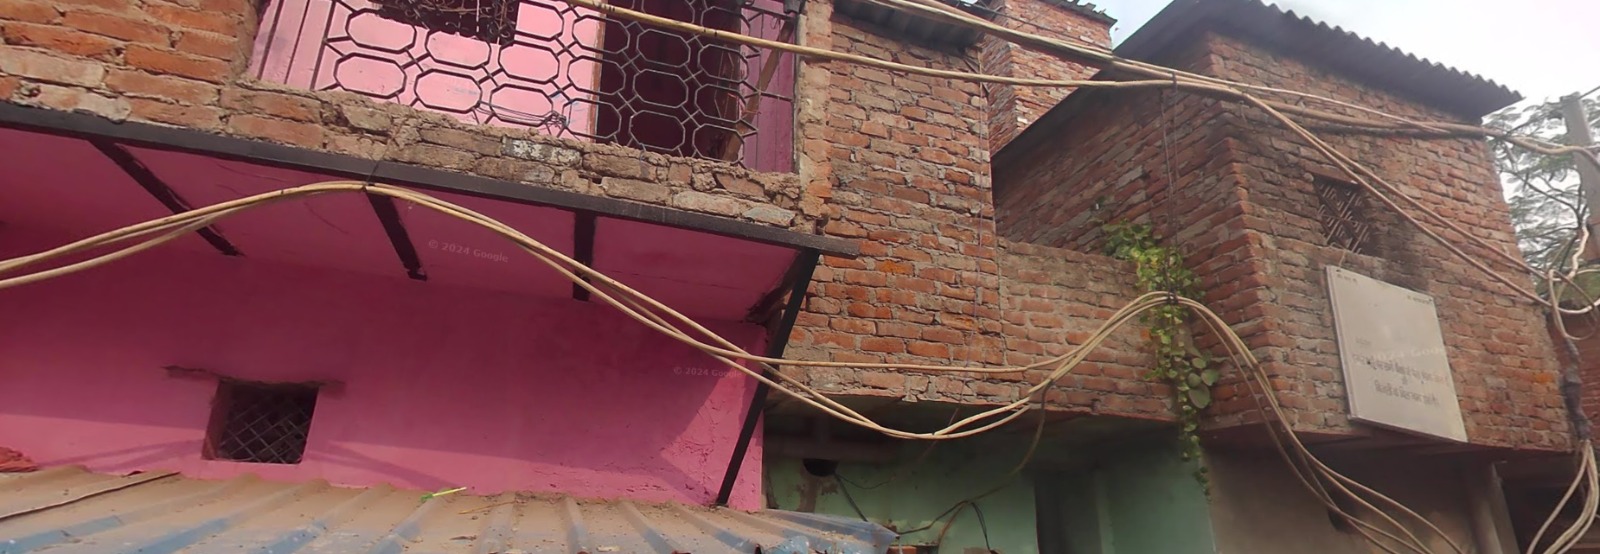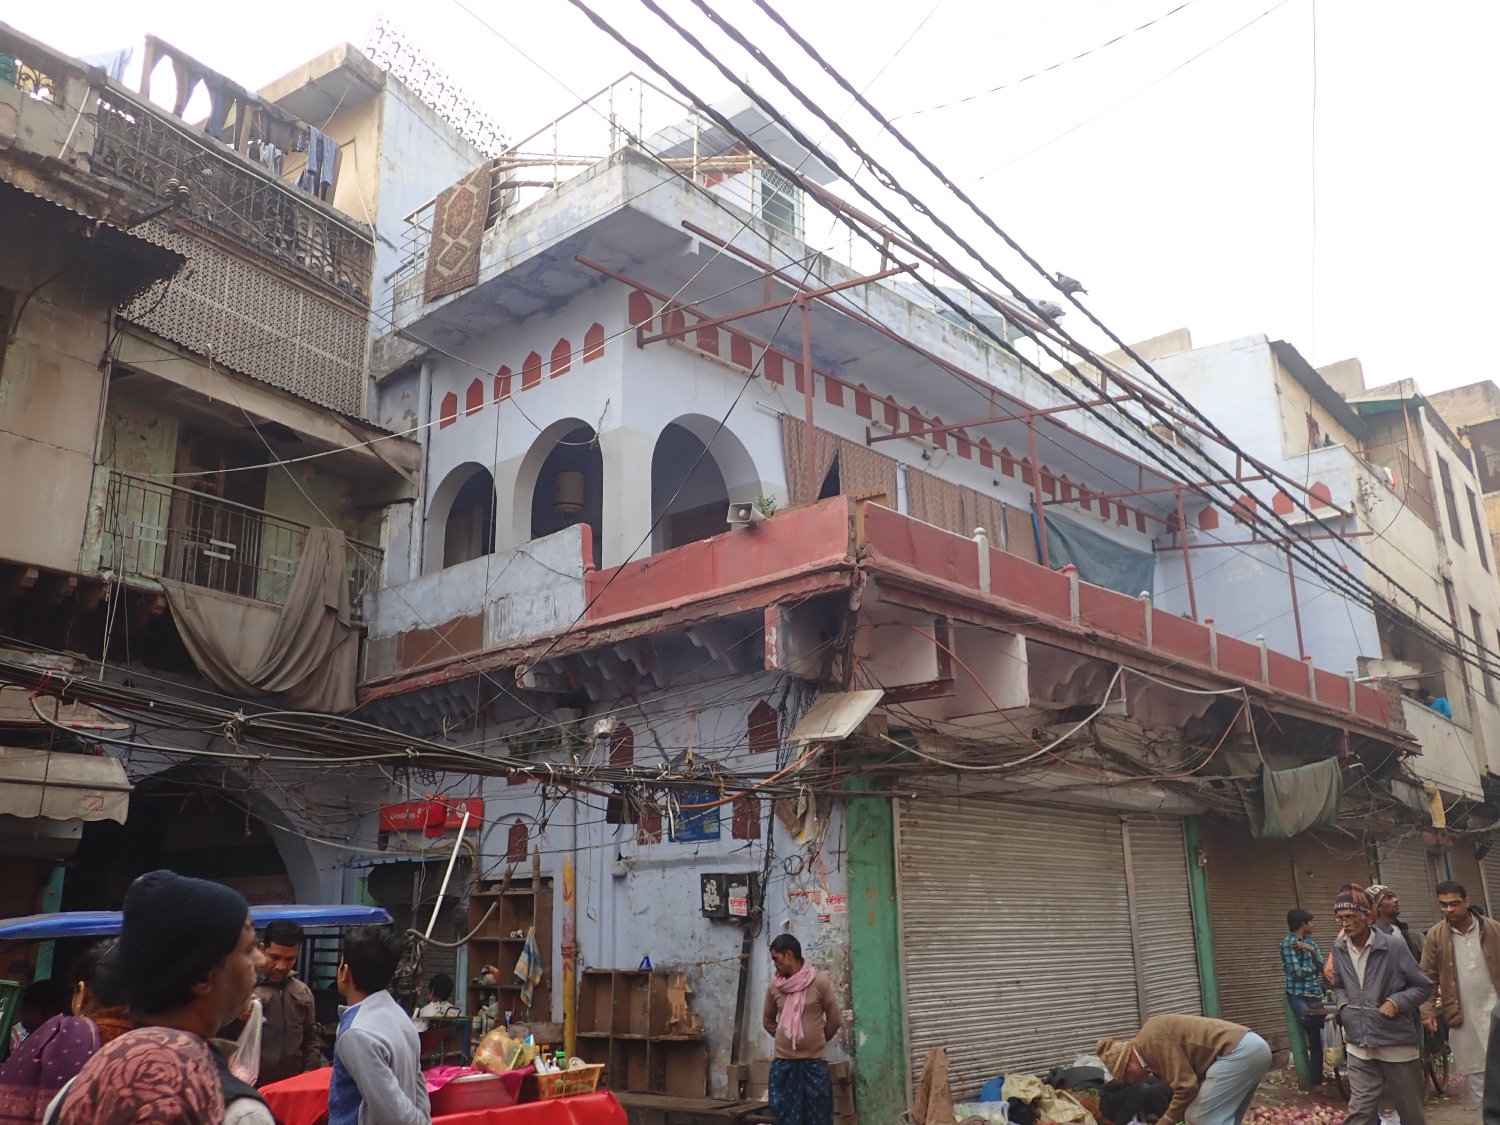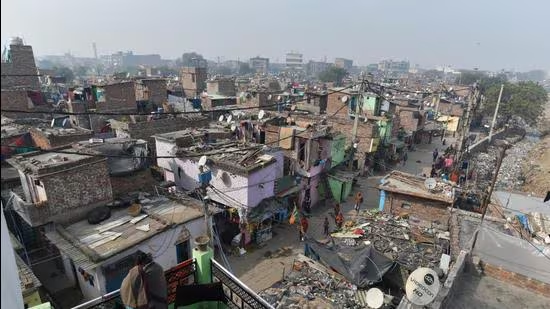
The presents a satellite-based temporal ring analysis showing land use/land cover (LULC) and index-based changes (NDVI and NDBI) over time. The visual transitions indicate both spatial and temporal dynamics within concentric buffer zones, likely centered around a key area — possibly a railway corridor or urban core.
Railway corridors have long been lifelines of economic growth and regional development in India. As catalysts of urbanization, connectivity, and industrial expansion, they also exert significant pressure on the surrounding landscapes. Over time, these zones witness dynamic transformations—from vegetation conversions and urban sprawl to encroachments and ecological degradation.
This project, titled “Tracks Through Time: Mapping Change Along Railway Corridors,” presents a geospatial story map that visualizes land use and land cover (LULC) changes along key railway alignments. By leveraging remote sensing and GIS technologies, the project captures spatial-temporal variations in built-up areas, vegetation cover, and infrastructural development adjacent to railway tracks.
Focusing on change detection, this interactive story map serves as a valuable tool for planners, railway authorities, environmental monitors, and local administrators. It not only highlights patterns of development and encroachment but also raises critical questions about sustainable growth and the need for spatial vigilance in railway-influenced zones.
Through this digital storytelling platform, users can explore satellite-driven insights, comparative temporal maps, and spatial analysis layers that depict how India’s railways are shaping—and being shaped by—the evolving landscape around them.
In this project, we aim to detect changes and identify encroachments along railway corridors using satellite images, maps, and GIS tools. First, we collect satellite data from Sentinel-2 and Landsat for different years to observe how land use has changed over time. Along with this, we use high-resolution images from Google Earth and Wayback to visually identify buildings and vegetation near the railway area.
Next, we calculate two important indices—NDVI to measure vegetation health and NDBI to detect built-up areas. By comparing these indices across years, we can find areas where green cover has reduced and buildings have increased, which are possible signs of encroachment. We also classify the land into different types like vegetation, built-up, and open land using LULC (Land Use and Land Cover) maps.
To better understand the impact, we create buffer zones around the railway lines—such as 5, 10, 15, 20 kilometer—and study the changes in each zone. We perform ring analysis and direction analysis to find in which direction the encroachments are spreading. We also classify buildings into official and non-official (unauthorized) using visual clues and maps.
Further, we analyze the tree canopy cover and count the number of trees lost in the area. Using kernel density tools in GIS, we locate areas with a high number of unauthorized structures, which helps identify risk zones. We also compare actual land use with official land use from the Master Plan 2025 and railway boundary data to spot violations.
Finally, we present the results using a story map and interactive dashboard. These tools will show the changes in land use, vegetation loss, and encroachment visually over time, making it easy for railway authorities and planners to understand the problem and take informed actions.
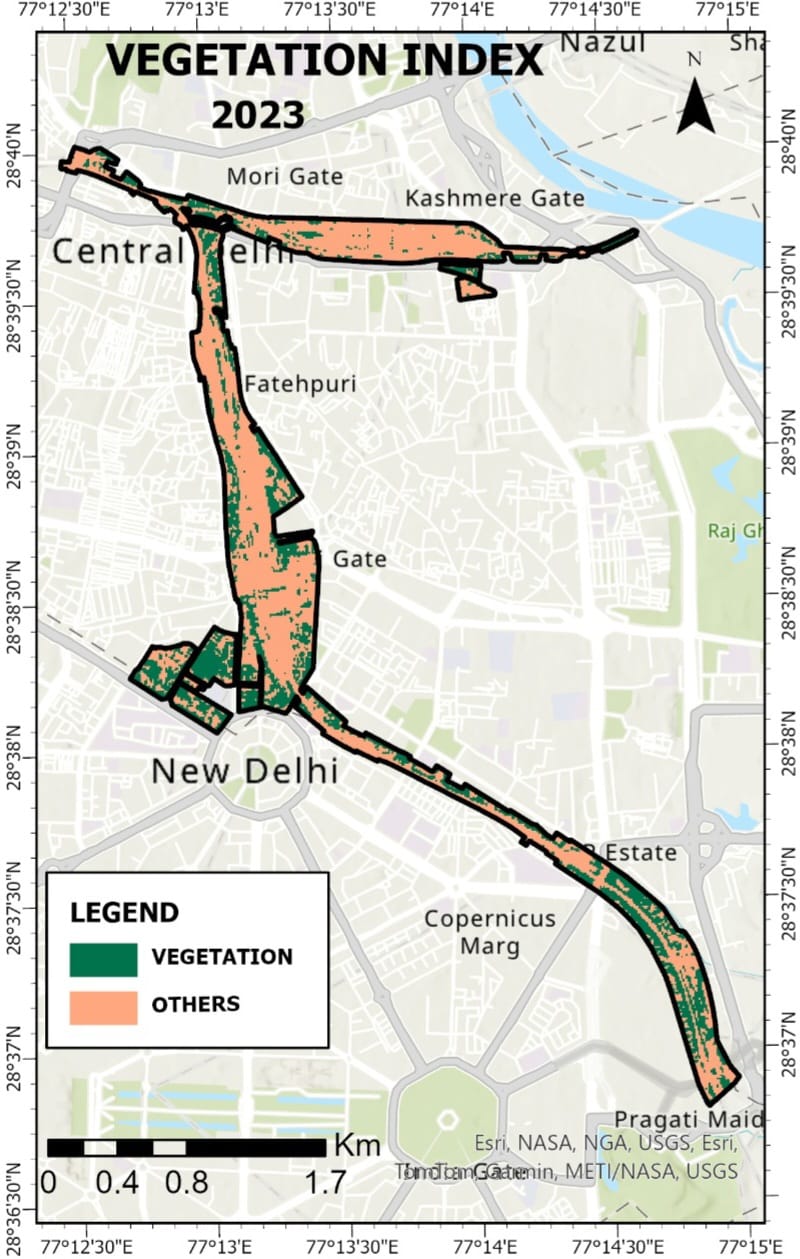
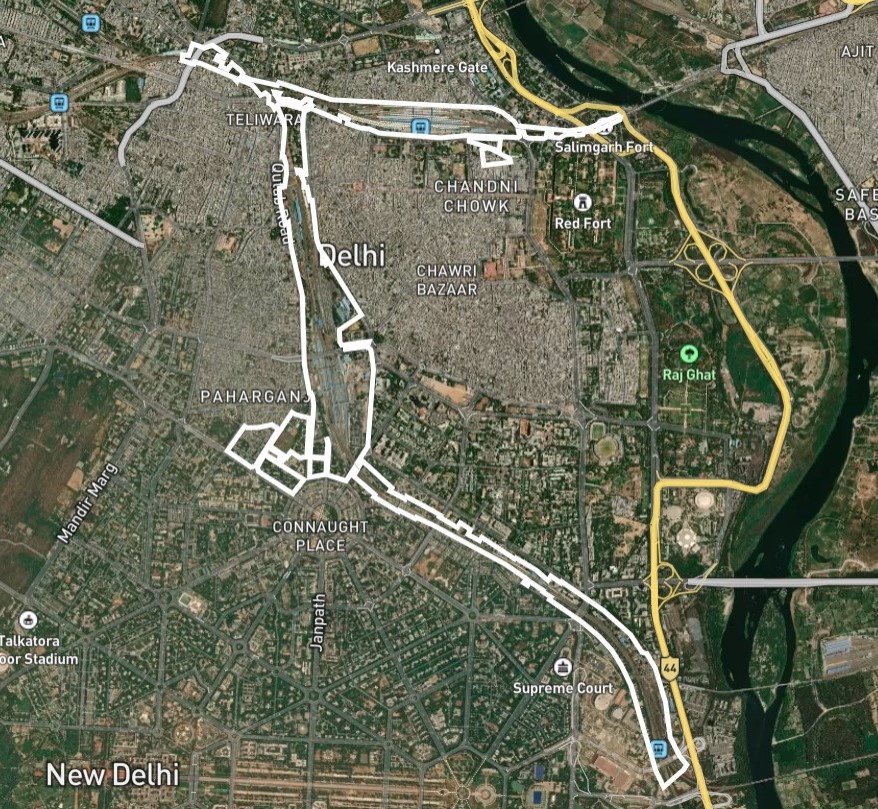
The highlighted white boundary in the image represents the New Delhi Railway Station corridor, which extends across some of the most densely populated and historically significant areas of central Delhi. This corridor includes key urban neighborhoods such as Paharganj, Connaught Place, Chandni Chowk, and Teliwara, and stretches towards Supreme Court, near Tilak Marg in the south and Kashmere Gate in the north.
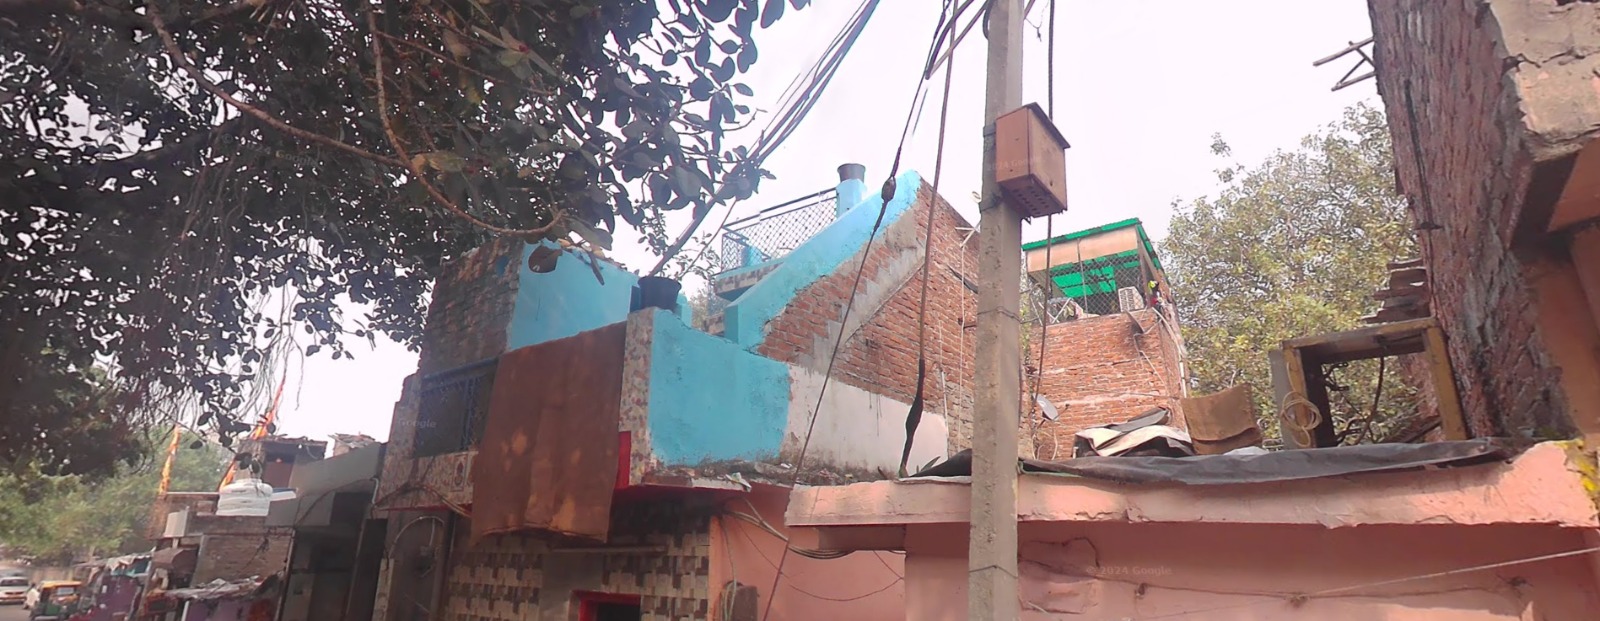
This region acts as a major transportation and transit hub, anchored by the New Delhi Railway Station, which is one of the busiest in India. The area is characterized by high human activity, unplanned commercial growth, and a mix of formal and informal settlements. These features make it a critical zone for studying urban sprawl, unauthorized constructions, and green cover loss.
Given its importance in city planning, historical legacy, and developmental pressures, this corridor is a strategic choice for conducting change detection analysis from 2018 to 2023. The study examines how built-up areas have expanded and how vegetative zones have been affected, particularly around railway lands and their immediate buffers. The spatial analysis in this study area provides insights for managing railway land encroachment, infrastructure impact, and sustainable urban growth in the heart of Delhi.
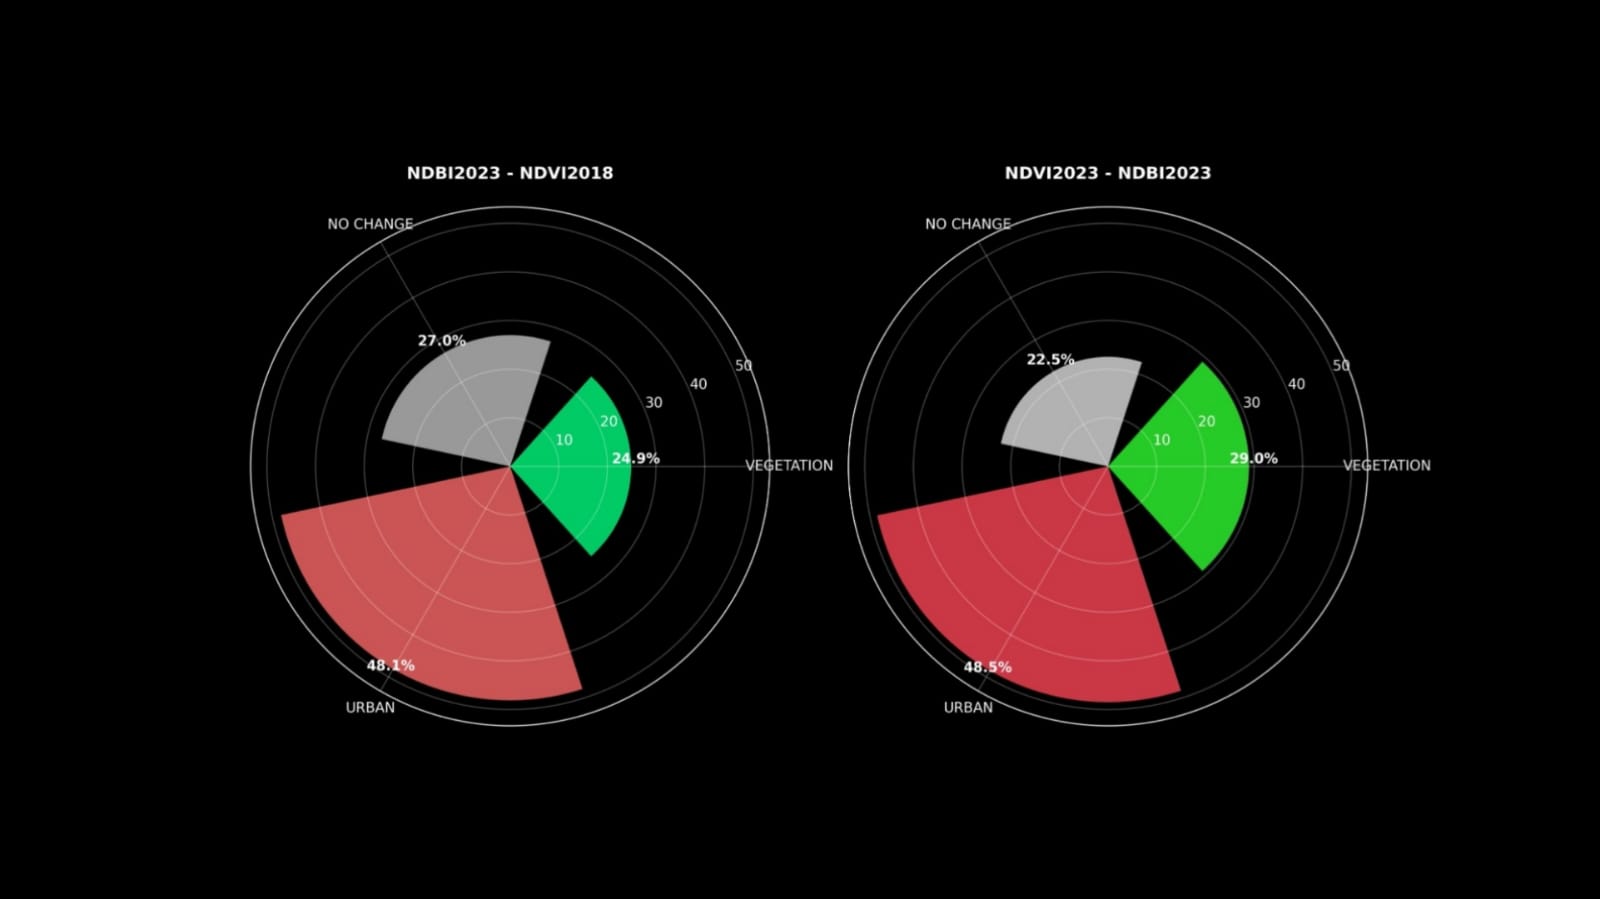
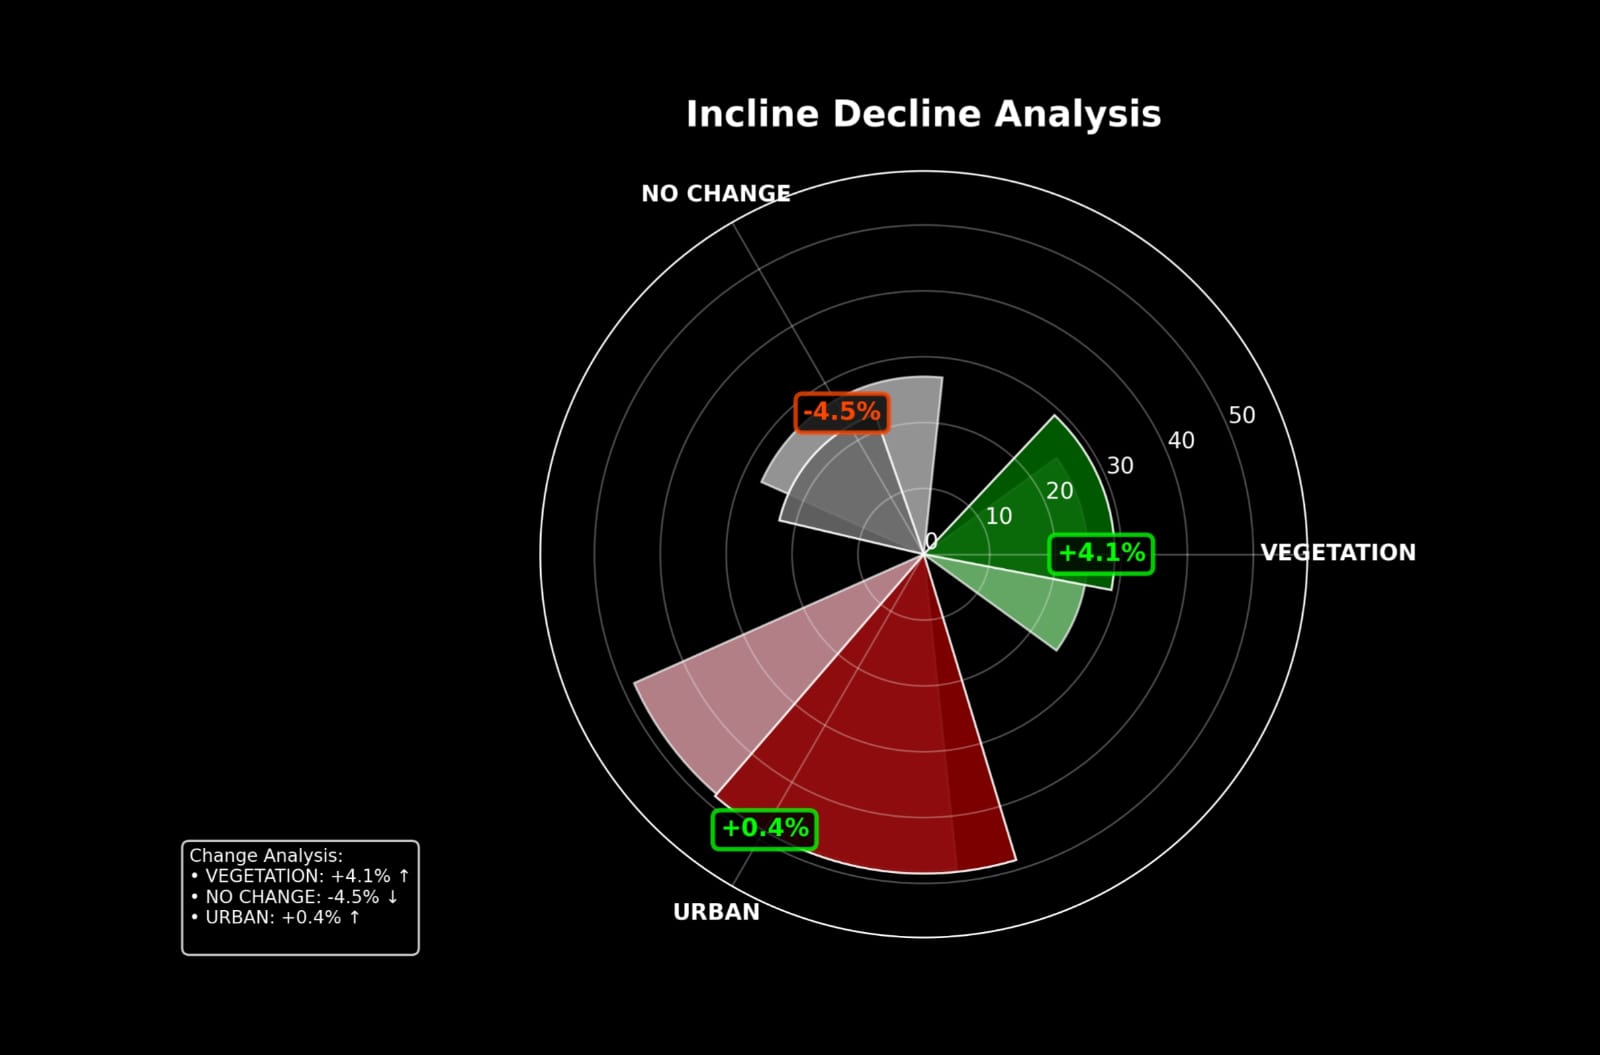
This chart visualizes the land-use transition from vegetated/open areas in 2018 (as detected via NDVI) to built-up areas in 2023 (from NDBI analysis).
This chart compares the present land classification within the railway boundary in 2023, identifying current land-use balance between vegetation and built-up.
India is turning train tracks into power plants — without halting a single train.
In a game-changing move for sustainable infrastructure, India startup Sun-Ways is deploying removable solar panels directly between railway tracks. Trains keep running, and clean energy keeps flowing.
This approach could produce over 1 terawatt-hour of electricity annually, potentially powering over 200,000 homes — all by reimagining the space we already have.
The five-year land cover transformation in New Delhi, captured through NDVI and NDBI analysis, paints a compelling but concerning picture: green is giving way to grey, and encroachment is at the heart of this shift.
From riverfronts to ridge zones, from urban villages to agricultural belts, encroachment has crept in silently but aggressively. Satellite imagery clearly shows:
These aren’t just isolated incidents—they reflect a systemic breakdown of urban land governance.
The stark contrast between NDVI (vegetation loss) and NDBI (built-up gain) reveals a deeper issue: Delhi’s planning processes are reactive, not preventive.
The outcome? A city where infrastructure strains, green cover disappears, and vulnerable populations live in unsafe, illegal settlements.
Delhi is at a critical junction. The findings from this story map are not just technical—they are a strategic alert. If current trends continue unchecked, the city risks becoming ecologically unstable, socioeconomically divided, and climatically vulnerable.
To reverse this trajectory, urban planning must evolve:
Encroachment is not just about buildings—it’s about the slow erasure of balance between nature and urban life. The maps don’t lie: Delhi’s green identity is being overwritten by unchecked growth. The time to act is now—through better tools, stronger governance, and an inclusive planning approach that values both people and the planet.